

A founder I know launched an AI writing tool at $29 a month. It sold fine. A year later, on a whim, he tried $49 for new signups. Signups dipped a bit. Revenue jumped 40%. He’d left that money on the table for twelve months because $29 “felt right.”
Here’s the thing. Your price is the single highest-leverage number in your whole business, and most of us pick it the same way we pick a restaurant: vibes, a quick glance at what competitors charge, and whatever number doesn’t make us flinch. That’s not a strategy. That’s a shrug with a dollar sign on it.
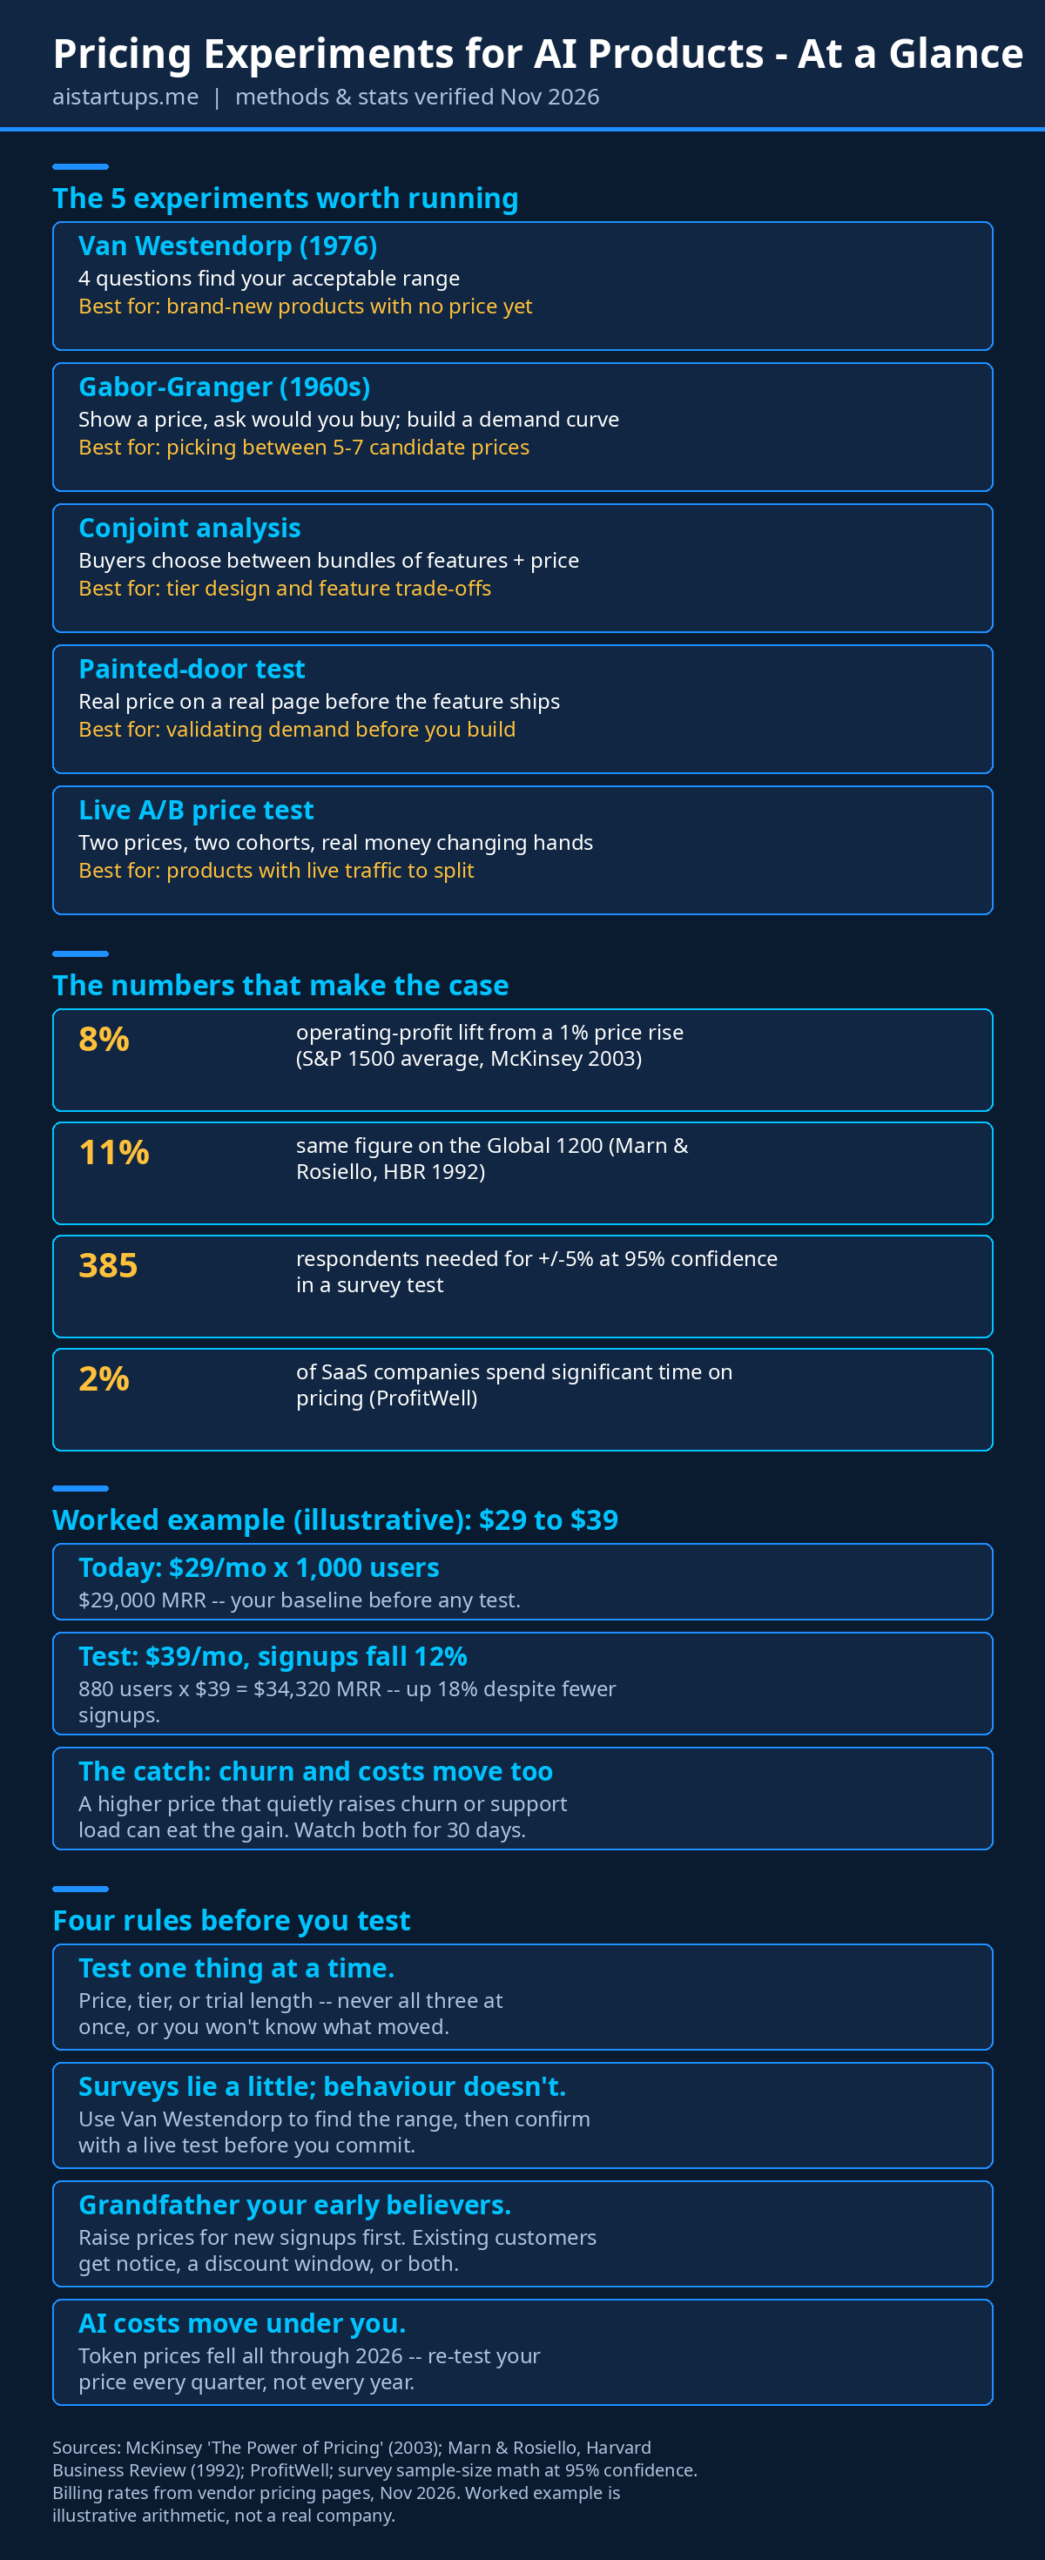
Real talk: the research on this is almost embarrassing. McKinsey ran the numbers on the average S&P 1500 company and found a 1% price rise — with volume held steady — lifts operating profit about 8%. The same 1% in volume? Roughly a third of that. And the older Global 1200 study put the price figure at 11%. Price beats volume, beats cost-cutting, beats almost everything else you could optimize. And yet most founders spend more time picking their logo font than testing their price.
So this is the guide I wish I’d had when I was setting prices by gut. We’re going to walk through the five pricing experiments that actually work, a seven-step playbook for running one without blowing up your business, and the traps that make smart founders read their results wrong. No PhD required. You need a survey tool, a billing platform, and the willingness to let data argue with your instincts.
Let’s get into it.
Why Your Price Deserves an Experiment, Not an Opinion
Let me put some numbers on the neglect, because they’re kind of stunning. ProfitWell’s research has long found that only about 2% of SaaS companies spend significant time on pricing optimization. Two percent. Meanwhile, an OpenView survey found only 30% of SaaS companies use data-driven methods to set prices at all. The rest are guessing, copying a competitor, or doing cost-plus math and calling it a day.
And it’s not like founders don’t know pricing matters. We all know it matters. We just never get around to it. Research from Maxio put it painfully well: executives spend about 11.5 hours over the entire lifetime of their business defining and testing pricing strategy — and roughly 15 hours a year choosing custodial supplies. We spend more time picking paper towels than setting the number that decides whether the business works.
Why? A few reasons, and I’ve done all of them. First, pricing feels personal. Raise it and you’re afraid customers will think you’re greedy. Lower it and you’re afraid you’re signaling the product isn’t worth much. Second, it feels risky — what if the test tanks conversions and you can’t undo the damage? Third, and this is the honest one, most of us don’t know how to run a proper test, so we never start.
Here’s what changed my mind: pricing isn’t a decision you make once. It’s a lever you pull on a schedule. The AI labs do this constantly, right in front of us. In November 2026, Anthropic launched Claude Fable 5.2 at $8 per million input tokens and $40 output — 20% cheaper than Fable 5.1. The same week, Meta launched Muse Ember at $0.10 per million input tokens for agent work. Token prices have been falling all year, which means the cost floor under your AI product keeps moving. If your price is a tattoo, theirs is a whiteboard. Guess which one survives 2026.
An experiment fixes all three fears at once. It replaces the personal judgment call with a test you can defend. It limits the blast radius — you test on new signups, or on a slice of traffic, not your whole customer base. And it gives you a repeatable process, so the second test is easier than the first. If you want the full background on how AI SaaS pricing works before you test anything, I wrote a complete guide to pricing an AI SaaS product that covers the models — per-seat, usage-based, tiers, and the token problem — in detail.
The Five Experiments Worth Running
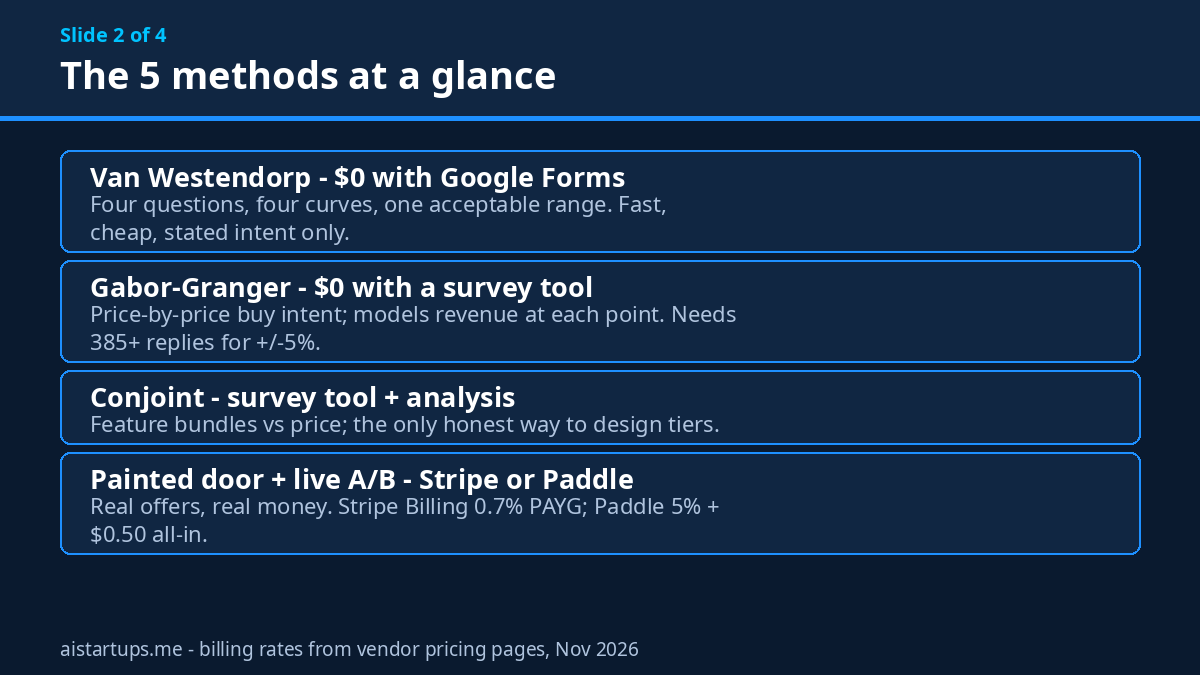
There are dozens of pricing research methods in the textbooks. You need five. Each one answers a different question, and picking the wrong one is the most common way founders waste a month. Here’s the short version, then the detail.
1. Van Westendorp: find your acceptable range
This one’s from 1976, from a Dutch economist named Peter van Westendorp, and it’s still the best starting point when you don’t have a price yet. You ask your target customers four questions:
- At what price would this product start to feel expensive?
- At what price would it be so expensive you’d never consider buying it?
- At what price would it start to feel like a bargain?
- At what price would it be so cheap you’d question its quality?
Plot the answers as four curves and the intersections give you a range: too cheap to believe, a bargain, the sweet spot, and too expensive to consider. What you get is a credible price band, not a single magic number. That’s a feature, not a flaw — it stops you from treating one survey answer as gospel.
The honest caveat: Van Westendorp measures what people say about price, not what they do at checkout. A price can feel acceptable in a survey and still lose the sale. So use it to find the range, then confirm with a real test before you commit. Google Forms runs it for free, which is hard to argue with.
2. Gabor-Granger: pick between candidate prices
Gabor-Granger is the next step up. Two economists, André Gabor and Clive Granger, cooked it up in the 1960s. You show people a specific price and ask a simple question: would you buy at this price? Then you step the price up or down and ask again. Do it across 5–7 price points and you get a demand curve — what share of buyers stays in at each price — and you can model revenue at every point.
This is the method to use when you already have a shortlist. Say you’re torn between $29, $39, and $49. Gabor-Granger tells you the $39 price keeps 70% of buyers while $49 keeps 45%, and suddenly the revenue math does itself: 700 buyers at $39 beats 450 at $49. Or the reverse. Either way, you’re deciding from a curve, not a hunch.
Sample size matters here. For results within about ±5% at 95% confidence, you want roughly 385 respondents. With 100–150 you get direction, not precision — fine for an early-stage product, not fine for repricing your whole customer base. If you want the full method, this walkthrough of Gabor-Granger and Van Westendorp for SaaS covers the survey design in more depth than I can here.
3. Conjoint analysis: design your tiers honestly
Here’s a problem surveys can’t solve with a single question: your price never exists in a vacuum. Buyers trade price against features, limits, support, and contract terms all at once. Conjoint analysis handles that. You show people bundles — “Pro at $39 with 10,000 credits and email support” vs “Pro at $49 with unlimited credits and priority support” — and they pick. Repeat enough times and the math reveals which features actually drive willingness to pay and which ones are just decoration.
This is the only method I’d trust to design tiers. Everything else guesses at what belongs in Pro vs Team. Conjoint tells you. It’s heavier to run — you need a survey tool that supports it and someone comfortable with the analysis — but for a product with three tiers and a real feature matrix, it’s the difference between tiers that sell and tiers that confuse people into the cheapest plan.
4. Painted-door testing: validate before you build
Sometimes the question isn’t what price, but whether anyone will pay at all. That’s the painted-door test. You put a real offer with a real price on a real page — before the feature or the product fully exists — and measure clicks on the buy button. When someone clicks, you tell them it’s coming soon and offer to join the waitlist.
Is that a little sneaky? A little. Be honest on the page — “join the waitlist” after the click, no fake checkout, no charging cards for a product that doesn’t exist. Done right, it’s the cheapest demand signal in this whole list, and it pairs naturally with the validation work you should be doing anyway — the painted-door test is basically validation with a price tag attached.
5. Live A/B price testing: the truth serum
Everything above is stated intent — what people say. A live A/B test is revealed behaviour — what people do when money is actually on the line. You split new traffic into two cohorts, show one group $29 and the other $39, and measure conversion, revenue per visitor, and churn over the next 30 days. The price that wins on revenue per visitor wins. Full stop.
This is the gold standard, and it’s also the one founders avoid, because it feels like the most dangerous. It isn’t, if you scope it right. Test on new signups only, so existing customers never see a change. Run it for a full billing cycle so you catch churn, not just signups. And pick a difference big enough to matter — $29 vs $31 won’t teach you anything. $29 vs $39 will.
The 7-Step Playbook (Steal This)
Methods are useless without a process. Here’s the one I’d hand to any founder, in order. It works whether you’re pre-launch or doing $50K a month.
Step 1: Pick ONE lever
Price, tier structure, or trial length. One. If you change the price and the trial length and the feature list in the same month, and revenue moves, you have no idea which change did it. Founders love to bundle changes because it feels efficient. It’s the opposite — it destroys the evidence.
Step 2: Write the hypothesis down
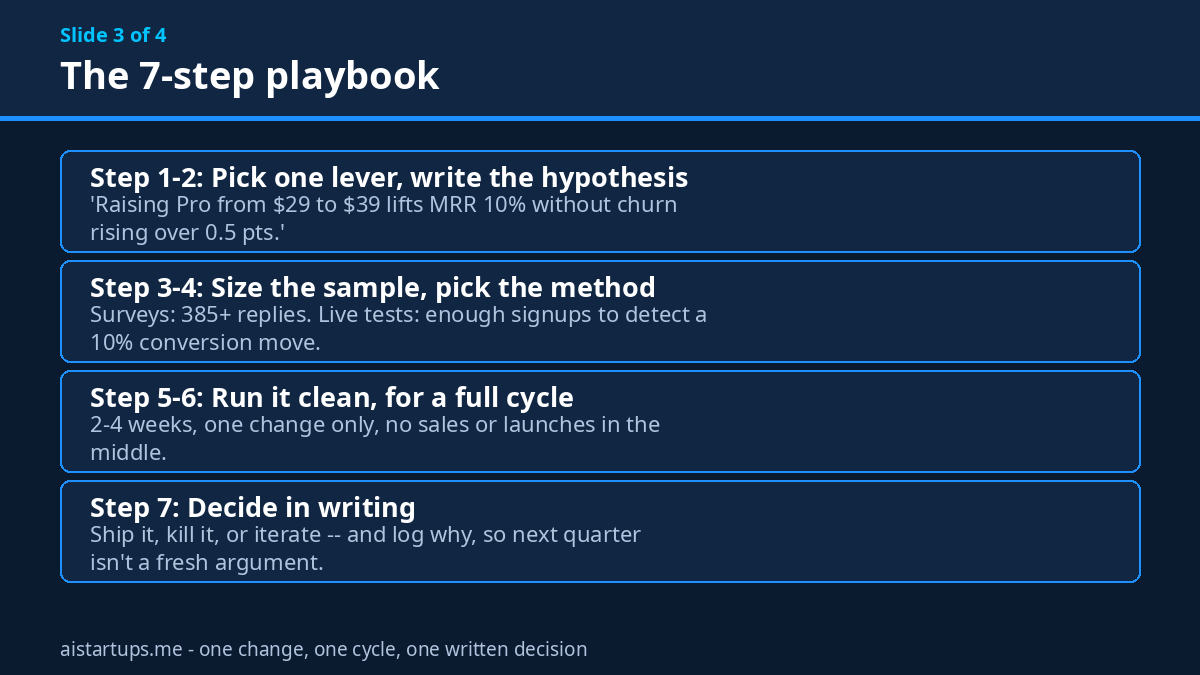
Not in your head. In a doc. Something like: “Raising Pro from $29 to $39 will lift monthly recurring revenue at least 10% without monthly churn rising more than 0.5 points.” A written hypothesis does two things. It forces you to name what success looks like before you see the data — so you can’t move the goalposts later — and it gives future-you the reasoning when someone asks why the price changed.
Step 3: Size the sample before you start
This is where most tests quietly fail. A survey test wants about 385 respondents for ±5% precision. A live A/B test wants enough signups in each arm to detect the change you care about — if your baseline conversion is 2% and you want to spot a move to 1.8%, you need thousands of visitors per arm, not hundreds. Run the sample-size math first. If you don’t have the traffic, run a survey method instead of a live test, or run the test longer. An underpowered test doesn’t give you a weak answer. It gives you a random one that looks like an answer.
Step 4: Choose the method that fits your stage
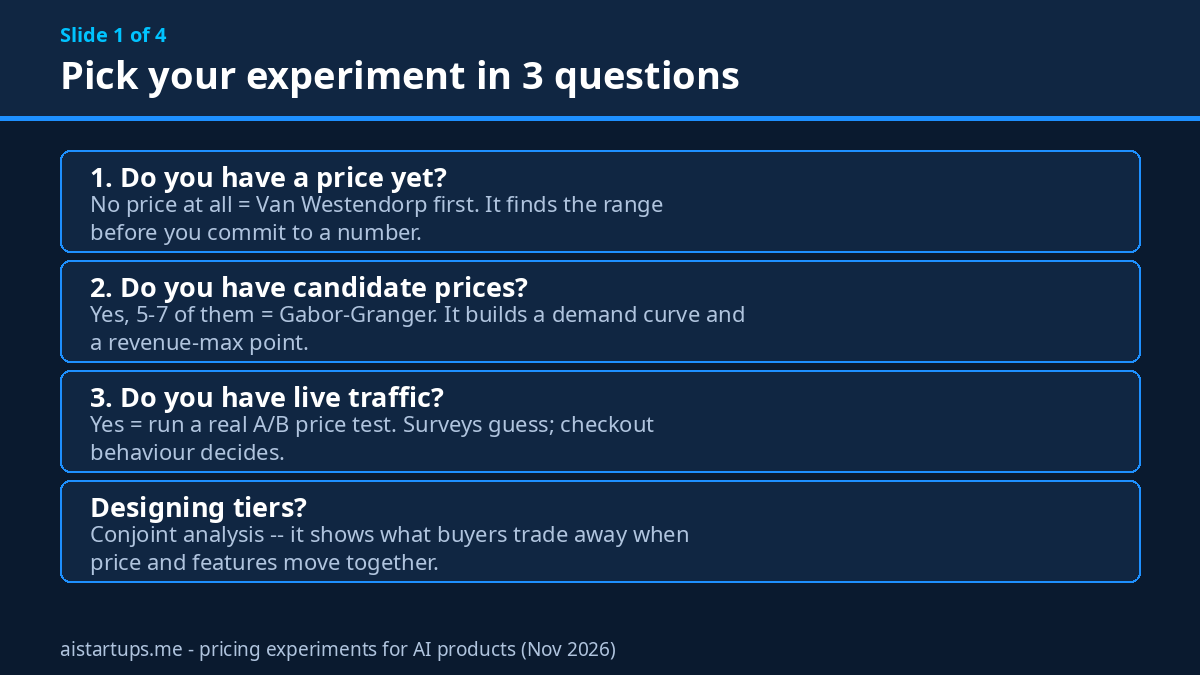
No price yet? Van Westendorp. Candidate prices? Gabor-Granger. Tiers to design? Conjoint. No product yet? Painted door. Live traffic and a live price? A/B test. Don’t run a live A/B test on a product with 40 visitors a week, and don’t run a survey when you could just watch real checkouts. Match the method to the evidence you can actually collect.
Step 5: Run it clean for a full cycle
Two to four weeks for most products. One change only. No product launch, no big marketing push, no holiday sale in the middle of the test window. I know — real life doesn’t pause. But every other event in the window is a variable you can’t separate from the price change, and the whole point of the exercise is separation. If something big lands mid-test, note it, extend the window, and be honest about it in your notes.
Step 6: Measure revenue per visitor, not conversion alone
This is the worked example, and it’s the heart of the whole article. Say your AI tool charges $29 a month and has 1,000 paying users. That’s $29,000 in monthly recurring revenue. You test $39. Signups fall 12% — which feels terrible, and would scare most founders into killing the test on day three.
Do the math instead. 880 users at $39 is $34,320 a month. That’s up 18% on fewer customers. Fewer support tickets, fewer servers to feed, more revenue. The test worked. The founder who kills it because conversion dipped just paid $5,320 a month for the comfort of a bigger user count.
But — and this matters — don’t stop at month one. Watch churn for a full cycle. A higher price can quietly raise churn or support load, and that eats the gain over 60–90 days. The right scoreboard is revenue per visitor in month one, plus churn and gross margin by month three. Speaking of margin, your price test is only as good as your cost math: if token costs eat 40% of your $29 plan, the $39 plan isn’t a 34% improvement, it’s a much bigger one. I wrote a full guide to unit economics for AI startups that walks through the CAC, gross margin, and API-cost math investors actually want to see — run your test numbers through it before you decide.
Step 7: Decide in writing
Ship it, kill it, or iterate — and write down why. “Shipped $39 for new signups on Nov 10 because revenue per visitor rose 18% and churn stayed flat for 30 days.” That one sentence is worth more than the test itself, because next quarter, when someone suggests $49, you won’t be arguing from memory. You’ll be arguing from a log. Keep a pricing decision log. Seriously. One page, one row per test, and it becomes the most valuable document in your company within a year.
Reading the Results Without Fooling Yourself
Most pricing tests don’t fail because the method was wrong. They fail because the founder read the results like a fan, not a scientist. Here’s the checklist I run before I believe any test.
The novelty effect. A price change gets attention. Existing users notice, a few complain loudly, and it feels like a revolt. It’s usually not. Measure the numbers, not the noise. If churn doesn’t move, the complaints were loud, not representative. Give it the full cycle before you react.
Seasonality. Testing a price in December and comparing it to November is testing Christmas, not pricing. Compare test vs control in the same window, always. That’s the whole point of running both arms at once.
The discount leak. McKinsey’s “Power of Pricing” work has a wonderful concept called the pocket price waterfall — the difference between your list price and what you actually keep after discounts, rebates, and giveaways. In one case they studied, a lighting company discovered its average pocket price was about half its list price after on- and off-invoice discounts. Fixing that — tightening discount rules and tracking pocket prices per account — lifted the average pocket price 3.6% and operating profits 51% in a year. Your price test means nothing if your sales team is quietly discounting the new price away. Check what customers actually pay, not what the pricing page says.
Anchoring, done honestly. Your highest tier makes your middle tier look reasonable — that’s anchoring, and it’s real. But don’t invent a $499 “Enterprise” tier nobody can buy just to make $49 look cheap. Customers figure it out, and the trust cost is higher than the conversion gain. If you want the psychology behind anchors, decoys, and the token-pricing trap in particular, my pricing psychology guide for AI products goes deep on all of it.
Statistical noise vs signal. A 3% conversion difference on 200 visitors is noise. Say it out loud before you act on it. If the test is underpowered, the honest result is “inconclusive, run longer” — not “the data says ship it.” Founders hate inconclusive. It’s still the right answer.
“Pricing has become as important a growth driver as customer acquisition.” — Patrick Campbell, founder of ProfitWell (now part of Paddle)
That quote has stuck with me because it reframes the whole thing. We treat acquisition as a growth engine and pricing as admin. The data says they’re the same size of lever — and pricing is the one almost nobody is pulling.
The AI-Specific Wrinkles (Don’t Skip These)
Pricing experiments for AI products have three quirks that plain SaaS doesn’t, and they change the math.
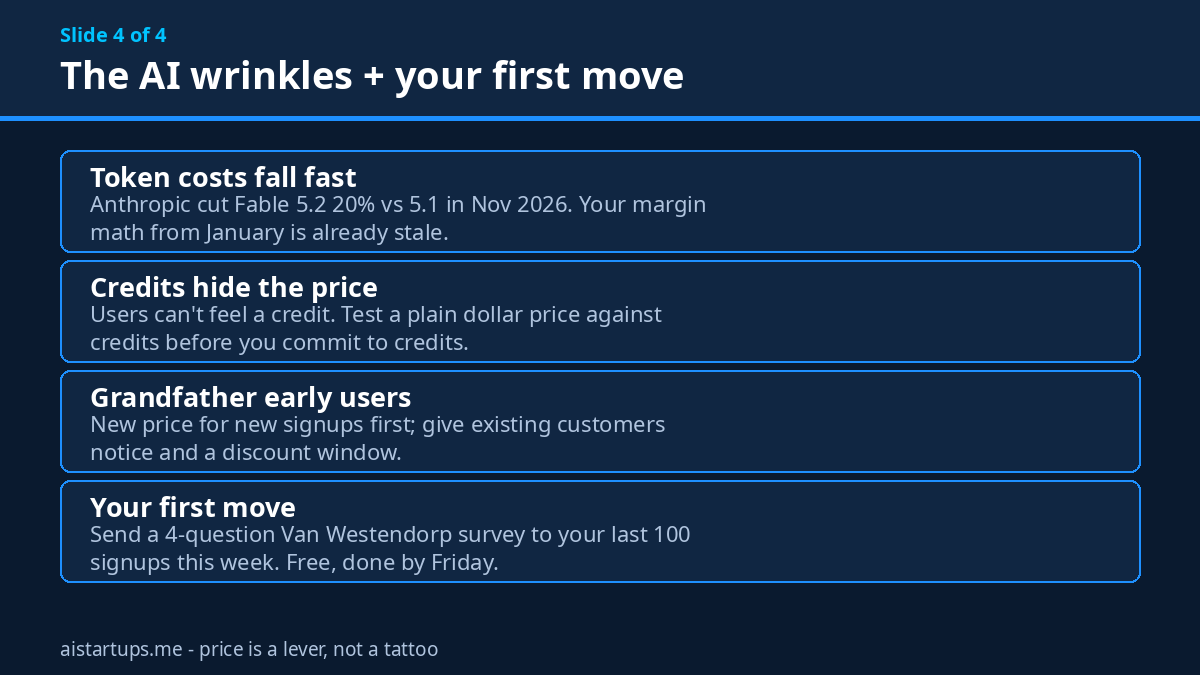
Your costs fall while you sleep. This is the big one. API and model prices dropped all through 2026 — Anthropic cut Fable 5.2 by 20% against its predecessor in November, Meta launched Ember at a tenth of a dollar per million input tokens, and every lab keeps repricing. That means the margin math you did in January is already stale. If your price is built on token costs, re-test it every quarter, not every year. A price that was tight at launch can become generous six months later, and a generous price is just money you gave away. I keep a running eye on this in my guide to cutting your AI API bill — the same cost levers that save you money change what your price should be.
Credits hide the price. A lot of AI products sell credits, not dollars. “1,000 credits a month” sounds clean until a customer tries to figure out what one credit actually buys. Credits make pricing experiments harder, because users can’t feel the price move. If you use credits, test a plain dollar price against the credit plan with a small cohort before you commit your whole pricing page to credits. The transparency usually wins on trust, even when the credit plan looks cheaper on paper.
Grandfather your early believers. This is a people rule, not a math rule. When you raise prices, raise them for new signups first. Give existing customers 30 days’ notice, a discount window, or a locked-in rate for a few months. The early users who trusted you at $19 are the ones writing your testimonials and answering support threads at midnight. A surprise price hike is how you turn your best advocates into your loudest critics. The revenue from grandfathering is smaller in month one and much bigger over a year, because you keep the customers who actually stay.
The Tools, and What They Actually Cost
You don’t need an expensive stack to run a pricing experiment. You need four things: a way to ask, a way to charge, a way to measure, and the discipline to wait.
Asking: Google Forms is free and runs a perfectly good Van Westendorp survey. Typeform is prettier and its AI builder writes the survey for you — Basic starts around $28 a month on annual billing. Either works. The questions matter more than the tool.
Charging: this is where the billing platform earns its keep, because a price test means running two prices at once, and not every platform makes that easy. Stripe Billing charges 0.7% of billing volume on pay-as-you-go, on top of card processing, and it handles multiple prices and metered usage natively — which is why most AI startups start there. Chargebee’s Flow plan runs 0.80% of invoicing volume, or $99 a month plus 0.65% if you commit, and it’s the pick when your billing logic gets complicated — multi-gateway, sales-led contracts, that kind of thing. Paddle takes 5% plus $0.50 per transaction, but it’s the merchant of record, so it handles global tax and VAT for you — worth it if you’re selling internationally and nobody on your team wants to own tax. All three were checked against their official pricing pages in November 2026, and all three change their pages often enough that you should confirm before you commit.
Measuring: ProfitWell Metrics is free and plugs into your billing system to give you MRR, churn, and cohorts — the exact numbers your test needs. If you’re already on Stripe, its built-in dashboards cover most of it. The point is to have one source of truth before the test starts, not three spreadsheets you reconcile after.
Presenting: and look, if the test says your pricing page itself is the problem — the tiers confuse people, the checkout leaks, the page reads like a spreadsheet — that’s a design job, not a pricing job. Rebuilding the page around the winning price is where a lot of founders stall, because it means touching the checkout flow. If that’s the bottleneck, getting a web development studio to rebuild the pricing and checkout flow around the new tiers is usually faster than doing it yourself between support tickets.
For the full method behind all of this — the Van Westendorp curves, the Gabor-Granger demand curve, the sample-size math — McKinsey’s Power of Pricing is the original source for the 8% figure and the pocket price waterfall, and it’s still the best single read on why price beats every other lever.
Frequently Asked Questions
How often should an AI startup test its prices?
At least once a quarter, and any time your costs move. Token prices fell all through 2026, so a price set in January can be badly wrong by October. A quarterly pricing review — one afternoon, one test, one decision — is the cadence that keeps you honest without turning pricing into a full-time job.
Will a price test anger my existing customers?
Not if you scope it right. Test new signups only, and grandfather existing customers with notice and a discount window. Most of the anger around price changes comes from surprise, not from the number. Tell people early, explain why, and the vast majority stay.
How many respondents do I need for a pricing survey?
About 385 for results within ±5% at 95% confidence. With 100–150 you’ll get direction — enough to pick a range — but not precision. If you can’t reach 385 real target customers, a smaller survey plus a painted-door test beats a big survey of the wrong people.
What’s the difference between Van Westendorp and Gabor-Granger?
Van Westendorp finds your acceptable price range when you don’t have a price yet — four questions, four curves, one band. Gabor-Granger picks between candidate prices you already have — it shows each price, measures buy intent, and builds a demand curve so you can model revenue at every point. Use Van Westendorp first, Gabor-Granger second.
Should I test price or features first?
Price, usually. It’s the highest-leverage lever you have, and it’s the fastest test to run. But if your tiers are the problem — everyone piles into the cheapest plan because the middle tier makes no sense — that’s a conjoint job, not a price job. Fix the tier design first, then test the price of the fixed tiers.
The Bottom Line
Your price is not a personality trait. It’s a hypothesis, and hypotheses get tested. The founders who win on pricing aren’t the ones with the best instincts — they’re the ones with a process: one lever, one written hypothesis, one clean test, one decision on the record. The methods are old — Van Westendorp is from 1976, Gabor-Granger from the 1960s — and they’ve survived because they work. The tools are cheap or free. The math takes an afternoon.
So here’s my challenge: run one test this month. Not a rebrand, not a new feature — one price test. Send the four Van Westendorp questions to your last hundred signups. It’s free, it takes a day to set up, and by Friday you’ll know something about your customers that your competitors are still guessing at. That’s the whole game. The price you pick by gut is a guess. The price you pick by test is a decision. And in a market where your costs fall every quarter and your competitors reprice every month, guessing is the most expensive option on the menu.